Prop Informer

Latest Coverage

All News →
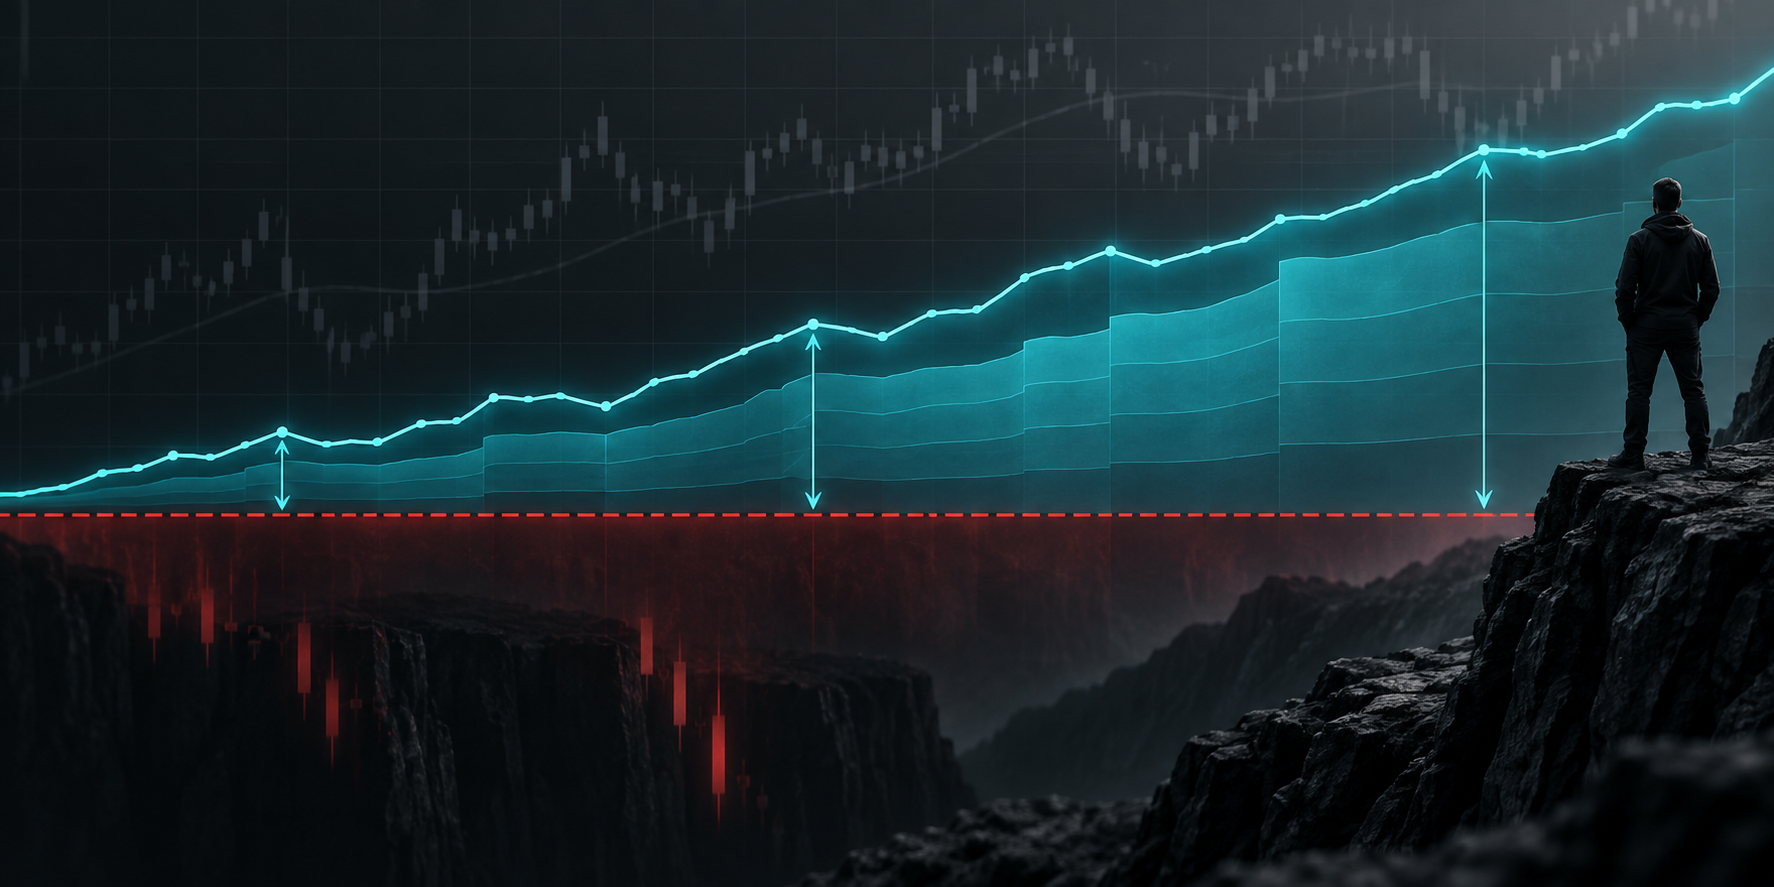
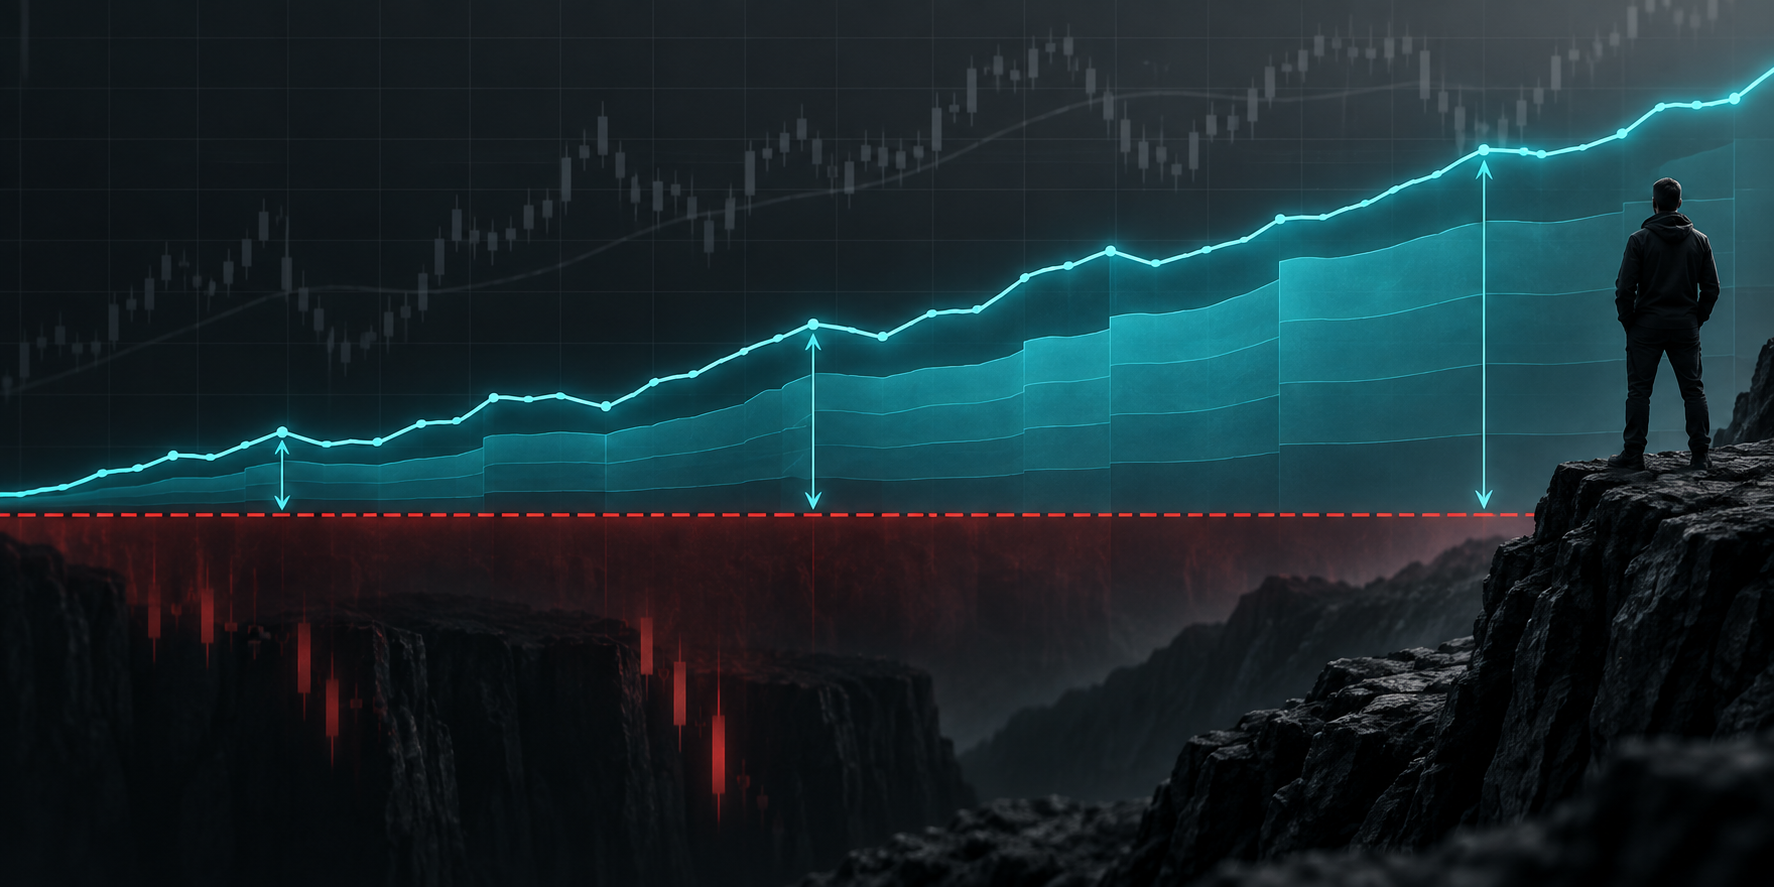
Mountains with two profit curves
Risk ManagementguideSep 20, 2026

Trailing Drawdown Explained: How It Works and Why Traders Fail It

A trailing drawdown is a moving loss threshold that may rise as an account reaches new highs. This guide explains how intraday, end-of-day, and static drawdown models work—and why misunderstood drawdown rules cause traders to fail otherwise profitable accounts.

SP3CULATOR

NQ1! Market Snapshot

Observed Oct 13, 11:45 AM CDT · 2 min old
NQ1!New York5m
30,778.50

Reported Market State

FAILED LOWER

Auction Activity

Rejecting Lower Prices

Range
9.20 ATR
ATR
24.3
Displacement
+6.57 ATR
Session
New York

Market context

As of Oct 13, 11:45 AM CDT

Price is inside the current value area and above RTH VWAP.

  • Nearest mapped level: Point of Control (30,781.00), 2.50 points above price.
  • Price is below the prior value area.
  • Nearby level cluster: Point of Control / VWAP +1 SD (30,781.00–30,782.52; midpoint 0.13 ATR from price).
  • Reported auction activity: Rejecting Lower Prices.
  • New York session range: 9.20 ATR. Net displacement: +6.57 ATR.

Market location

Current value
Inside
Prior value
Below
RTH VWAP
Above
Prior RTH VWAP
Below

Nearby levels

  • Point of Control30,781.00

    close · 2.50 pts · 0.10 ATR · Price below

  • VWAP +1 SD30,782.52

    close · 4.02 pts · 0.17 ATR · Price below

  • OR15 High30,791.75

    extended · 13.25 pts · 0.55 ATR · Price below

  • Prior Week Low30,792.00

    extended · 13.50 pts · 0.56 ATR · Price below

Level clusters

Point of Control / VWAP +1 SD

30,781.00–30,782.52

Midpoint 3.26 pts from price · 0.13 ATR to midpoint

OR15 High / Prior Week Low

30,791.75–30,792.00

Midpoint 13.38 pts from price · 0.55 ATR to midpoint

Value Area High / Previous 4H High

30,805.00–30,806.25

Midpoint 27.13 pts from price · 1.12 ATR to midpoint

FAILED LOWER

Latest market-state snapshotPowered by SP3CULATOR

Risk notice: SP3CULATOR describes observed market conditions for informational and educational purposes. It is not investment advice, a trade signal, a forecast, or a recommendation to buy or sell any financial instrument. Market data may be delayed, incomplete, or inaccurate. Read the full disclaimer.