01
Session structure
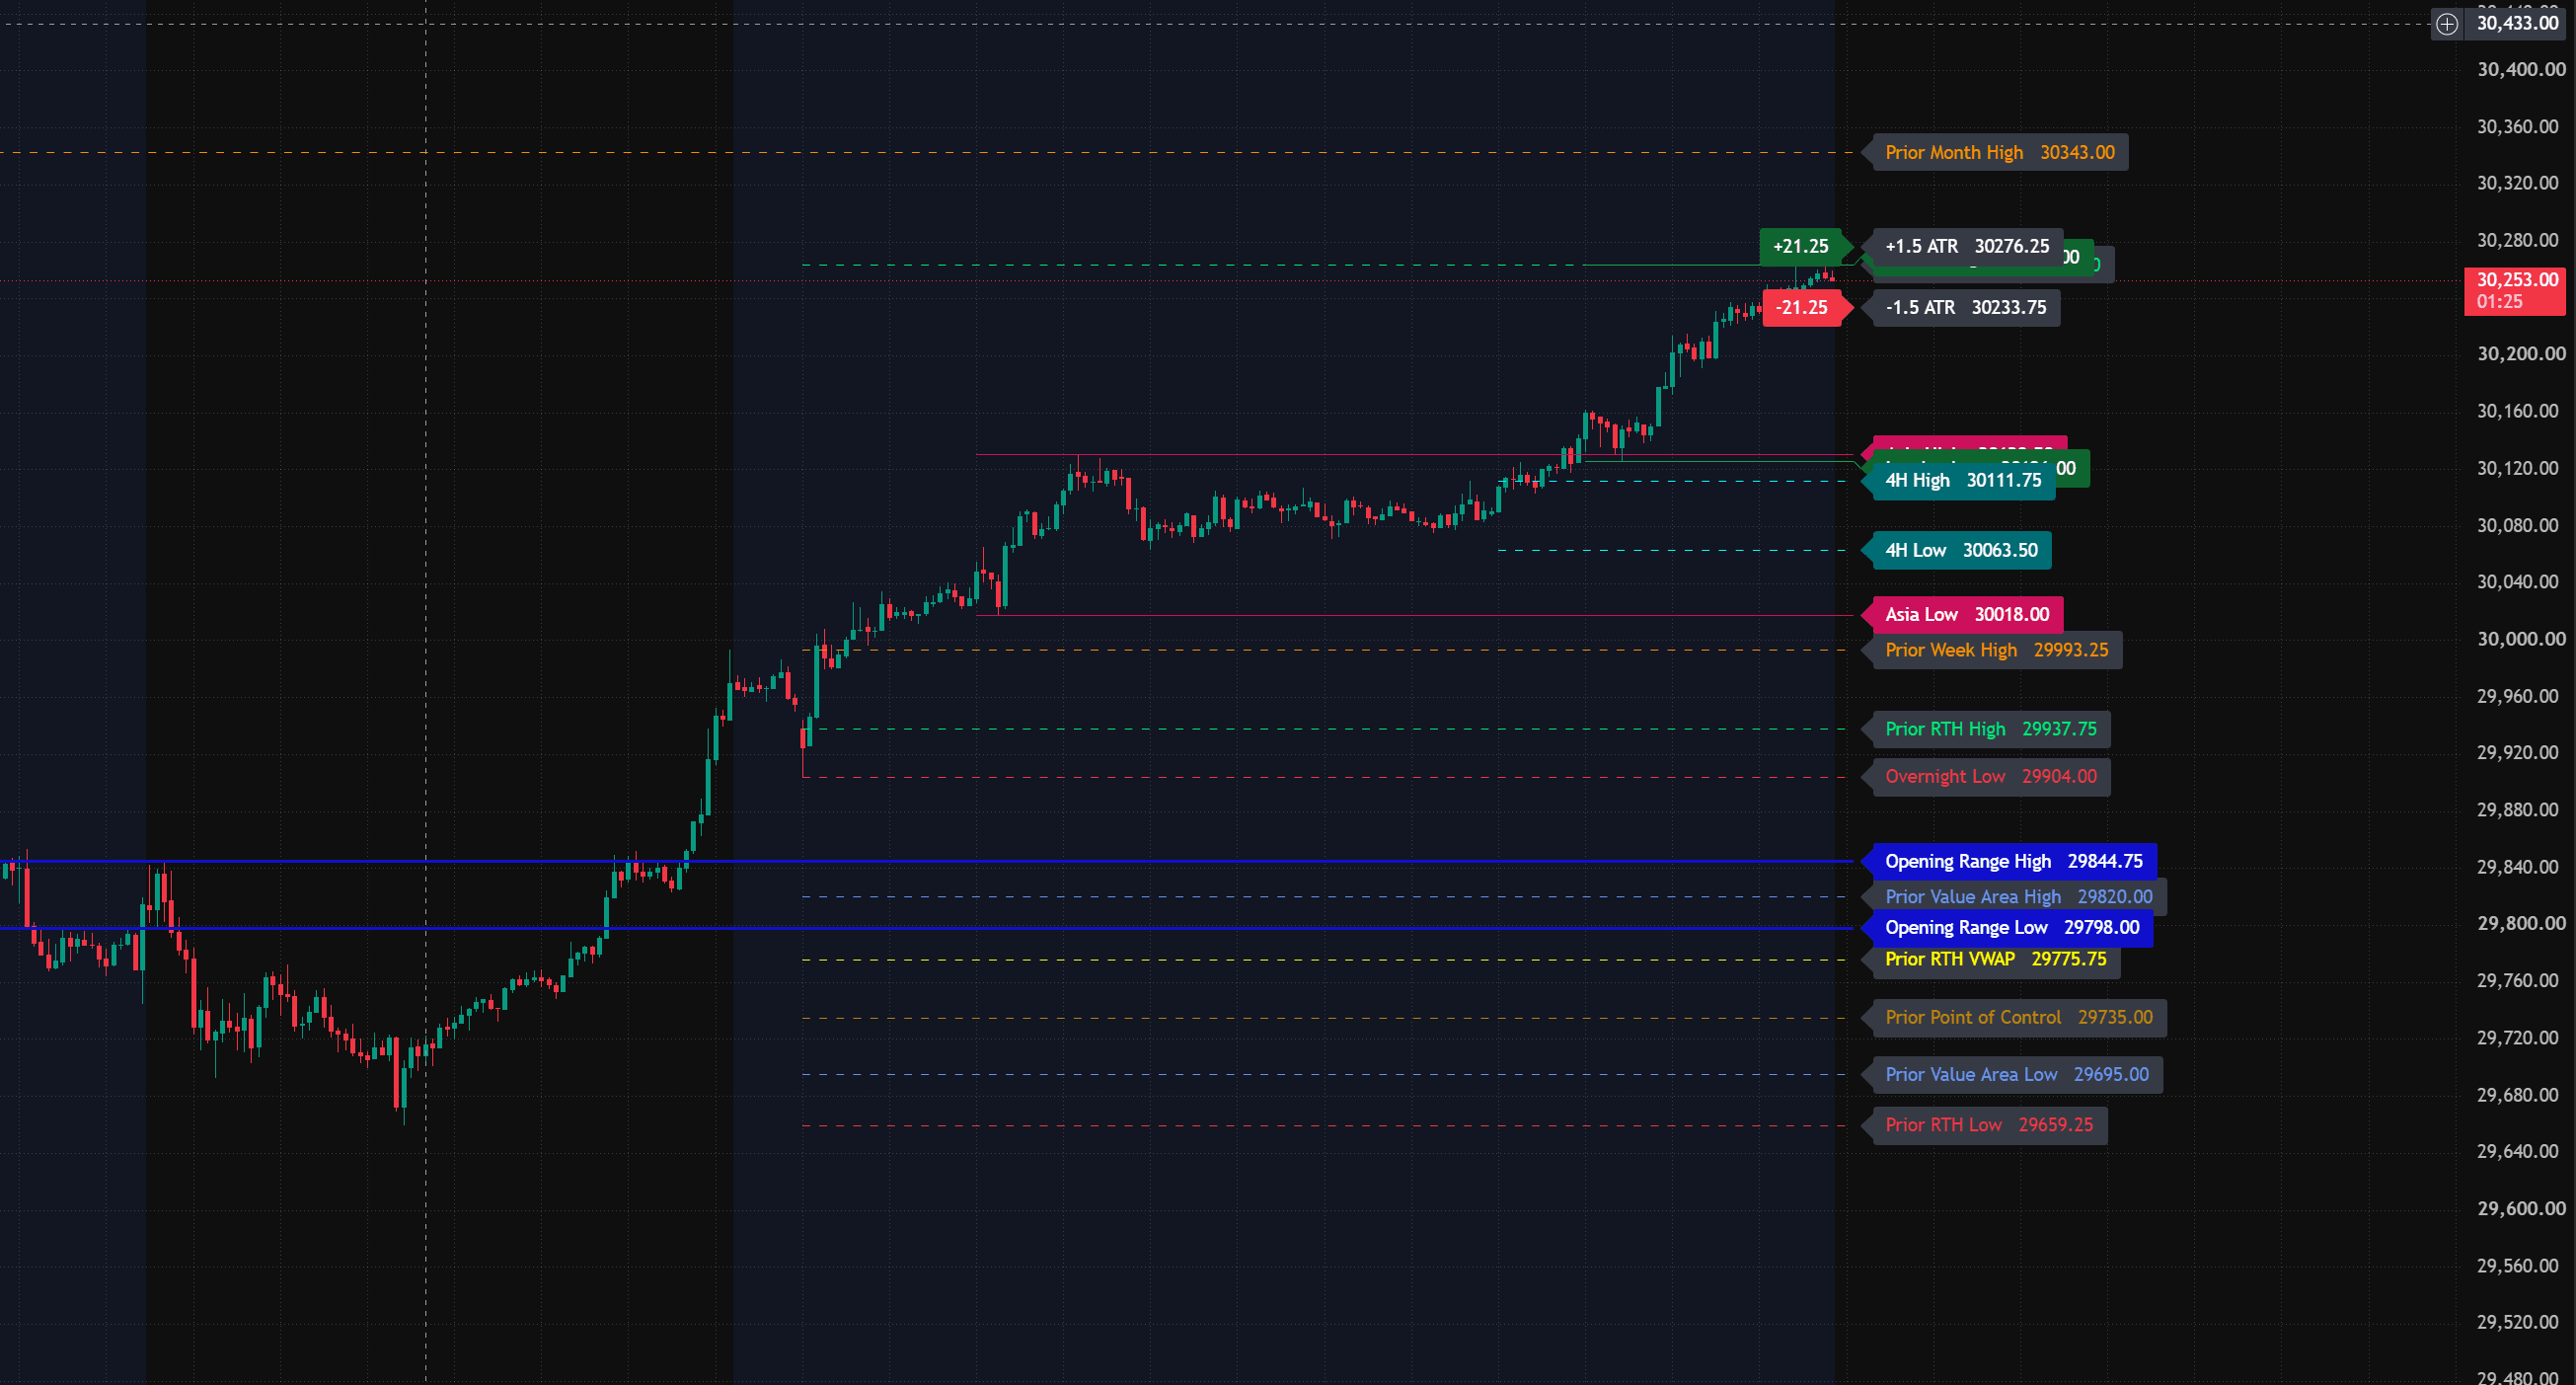
Asia, London, New York and overnight highs and lows show where each auction established its boundaries.

SP3CULATOR brings market-generated levels, session structure, volatility and observed auction activity into one contextual view—then condenses that information into Prop Informer’s live NQ market snapshot.
“SP3CULATOR doesn’t tell you what the market will do. It helps you understand what the market is doing.”
The purpose
A chart can contain dozens of technically valid reference points. The difficult part is not drawing more lines. It is keeping the references that matter visible, understanding how price is behaving around them and preserving the sequence of the market’s auction across sessions.
SP3CULATOR was built to consolidate that information. It organizes selected facts about price location, session range, displacement, value, volatility and nearby structure without presenting a mechanical trade instruction.
Facts don’t change with volatility. Interpretation does.
The chart layer
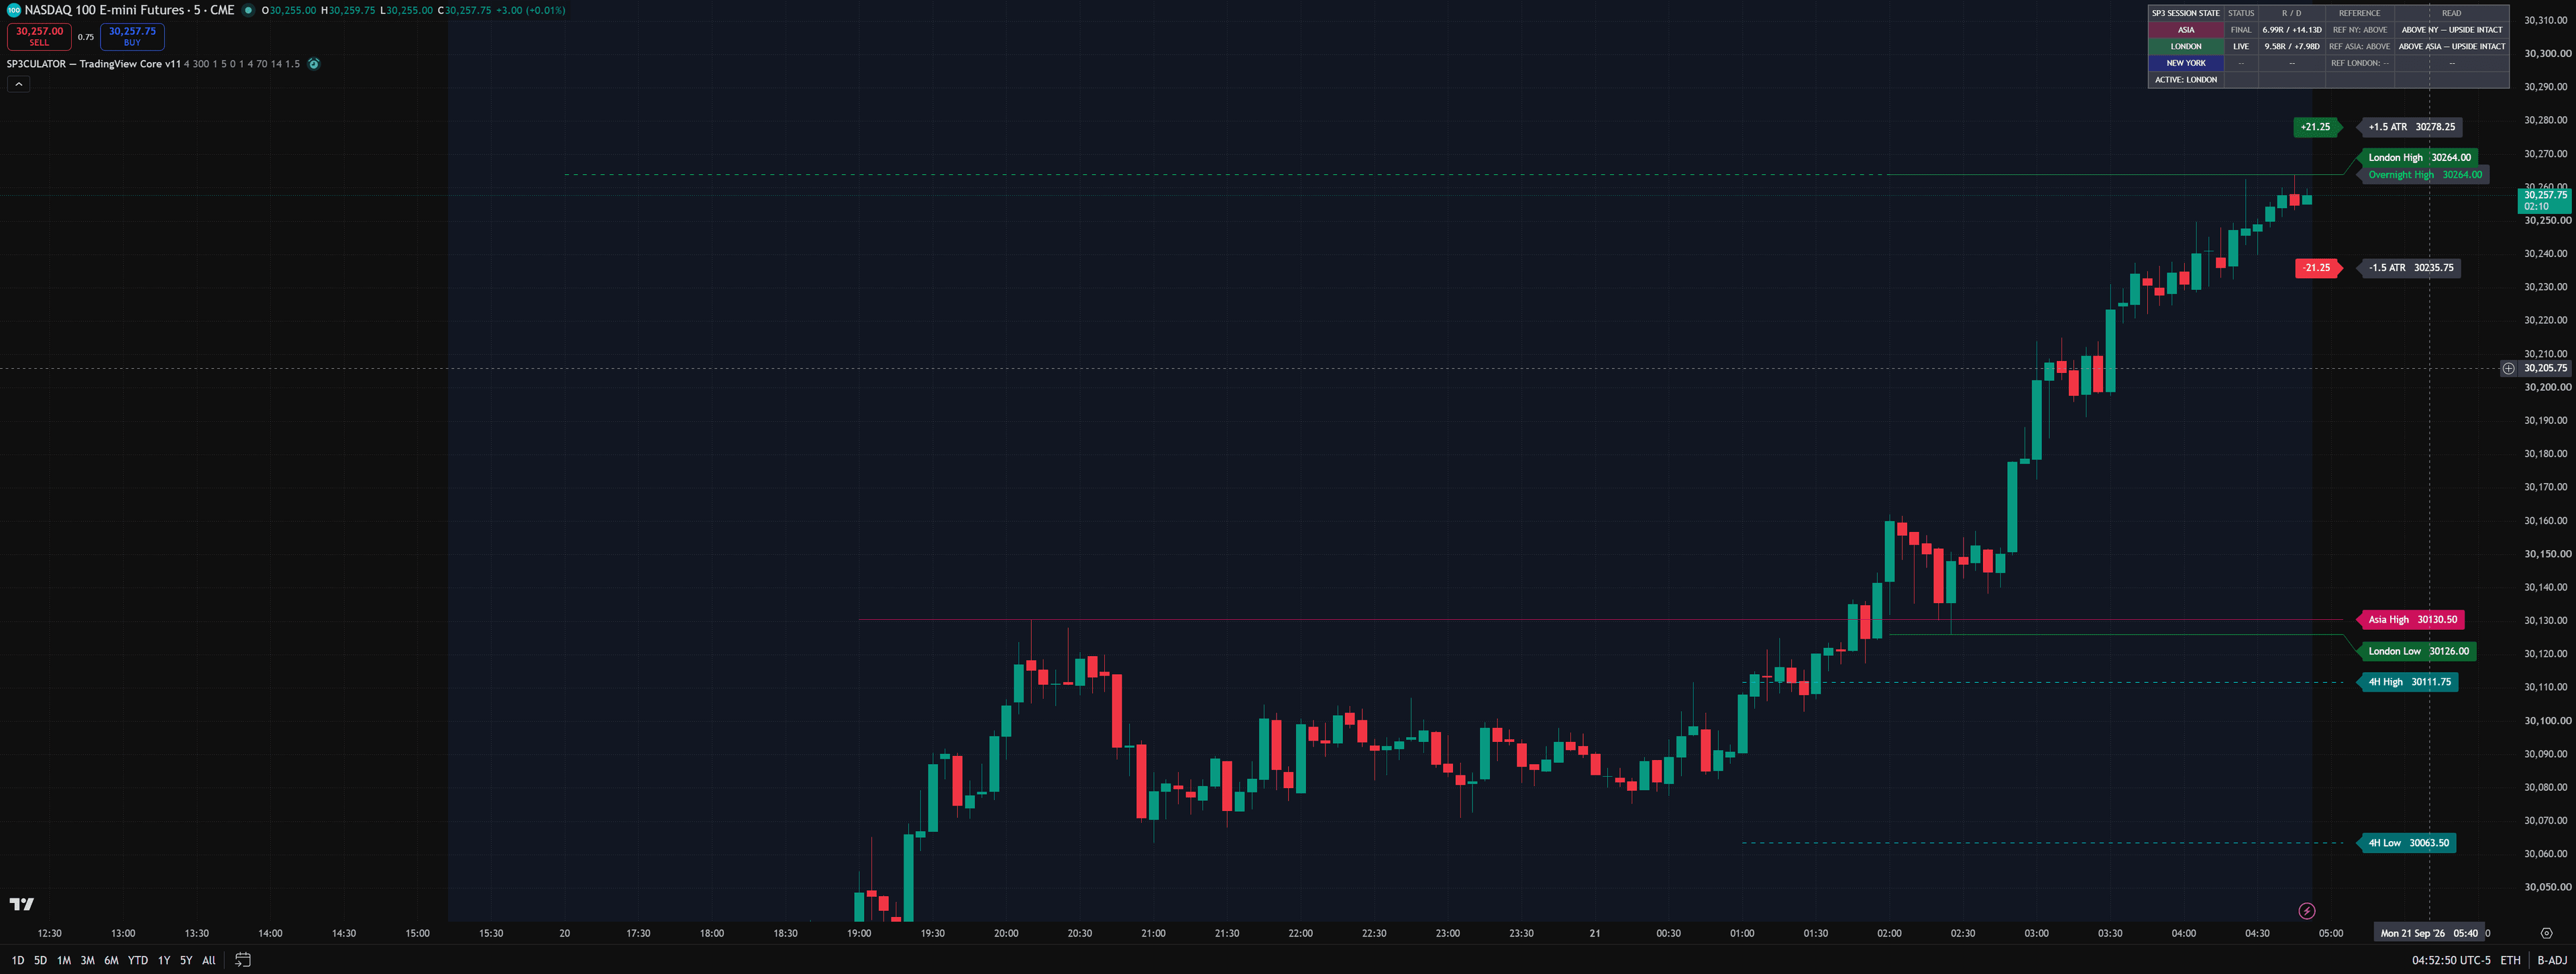
The indicator separates different types of information through a consistent visual language. Levels remain tied to price while their labels are organized into a readable rail outside the active candles.
Asia, London, New York and overnight highs and lows show where each auction established its boundaries.
Current and prior regular-session highs, lows, VWAP and settlement provide context for the active day.
Value-area highs and lows plus the point of control identify where the regular-session auction previously found acceptance.
The opening range establishes an early-session reference for acceptance, rejection and range expansion.
ATR-normalized distances make a move easier to evaluate across changing volatility conditions.
Four-hour and other selected references keep nearby structure visible without turning the chart into an indiscriminate level map.
Sessions in sequence
Markets do not reset when one geographic session hands activity to the next. Asia can establish a range, London can displace away from it, and New York can inherit both the move and the unresolved references left behind.
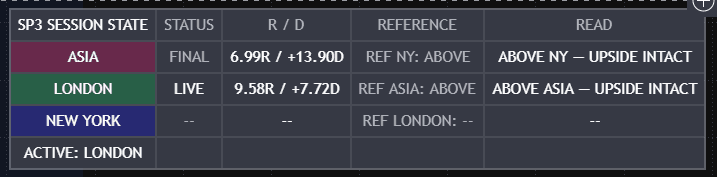
SP3CULATOR measures each session’s range and displacement in ATR terms, then evaluates its position relative to the prior session. The goal is to preserve the path—not merely report the current price.
Reading the label rail
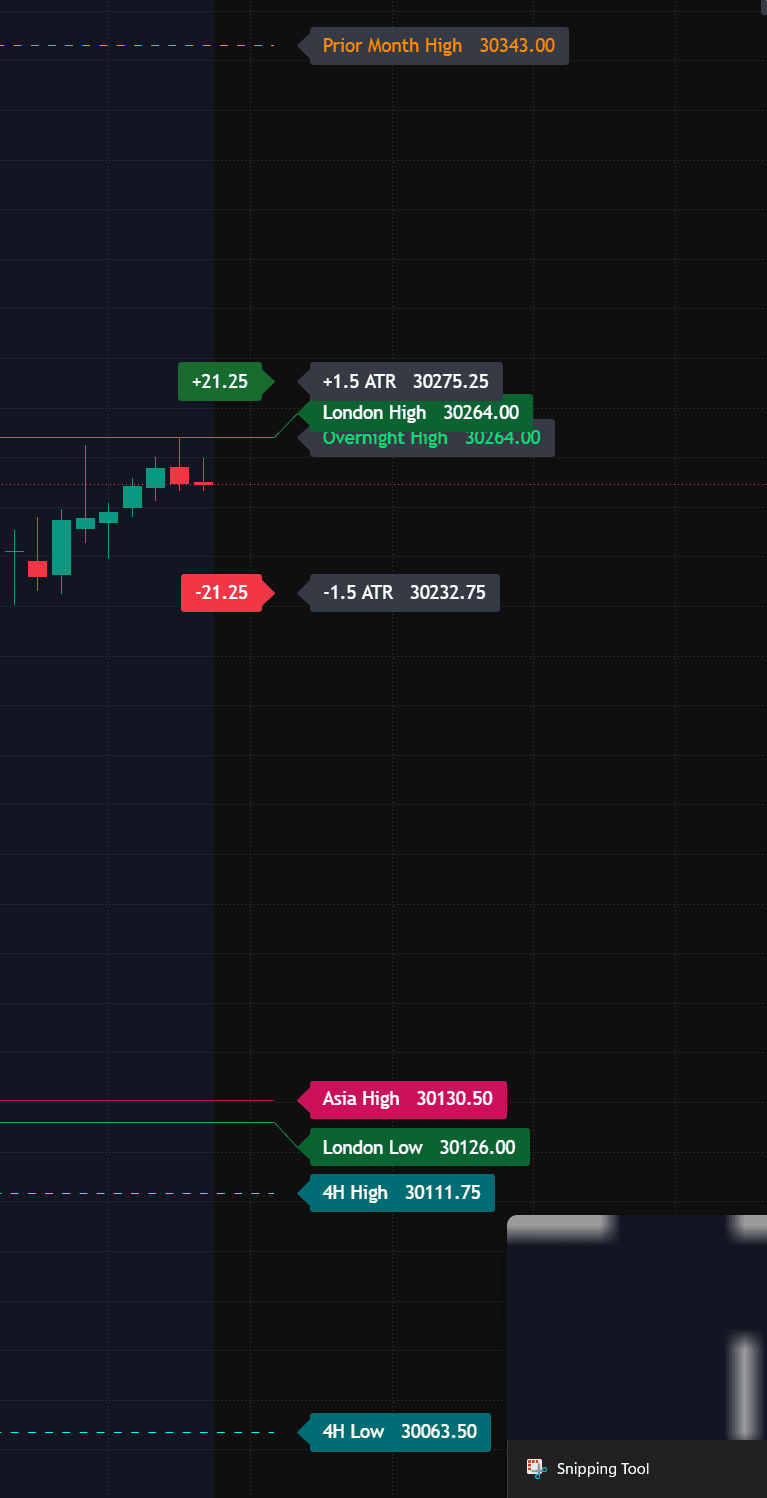
Color identifies the family of a reference. The label provides its exact price. Distance badges show how far selected levels sit from the current market in both points and ATR terms.
Why normalize with ATR?
Twenty points can represent ordinary noise in one environment and a meaningful extension in another. ATR supplies the volatility context that a raw point distance cannot.
Interpretation layer
The Session State panel condenses each completed or active auction into a small set of comparable measurements.
Beyond the snapshot
Independent reporting and analysis covering prop firms, trading rules and the developments affecting futures traders.

U.S. stocks are moving toward near-continuous trading while CME is already testing weekend access in futures.
Read the story →

Prop firms advertise account sizes of $50,000, $100,000 and even $150,000, but those numbers often tell traders very little about how much risk they actually have.
Read the story →
The SP3CULATOR workflow
SP3CULATOR identifies selected market-generated references and keeps their labels organized away from the candles.
It evaluates range, displacement, location, tests and observed acceptance or rejection around important areas.
The current session is read against the structure created by the sessions that came before it.
The public snapshot translates the chart into a concise market-state summary that can be followed away from the trading platform.
Shareable market intelligence
Prop Informer’s public snapshot carries the essential context away from the chart: the current market state, observed auction activity, nearby references, session range and net displacement.
Snapshots are posted on X to document changing conditions throughout the futures session and give readers a consistent framework for understanding the market’s current structure.
See snapshots on X ↗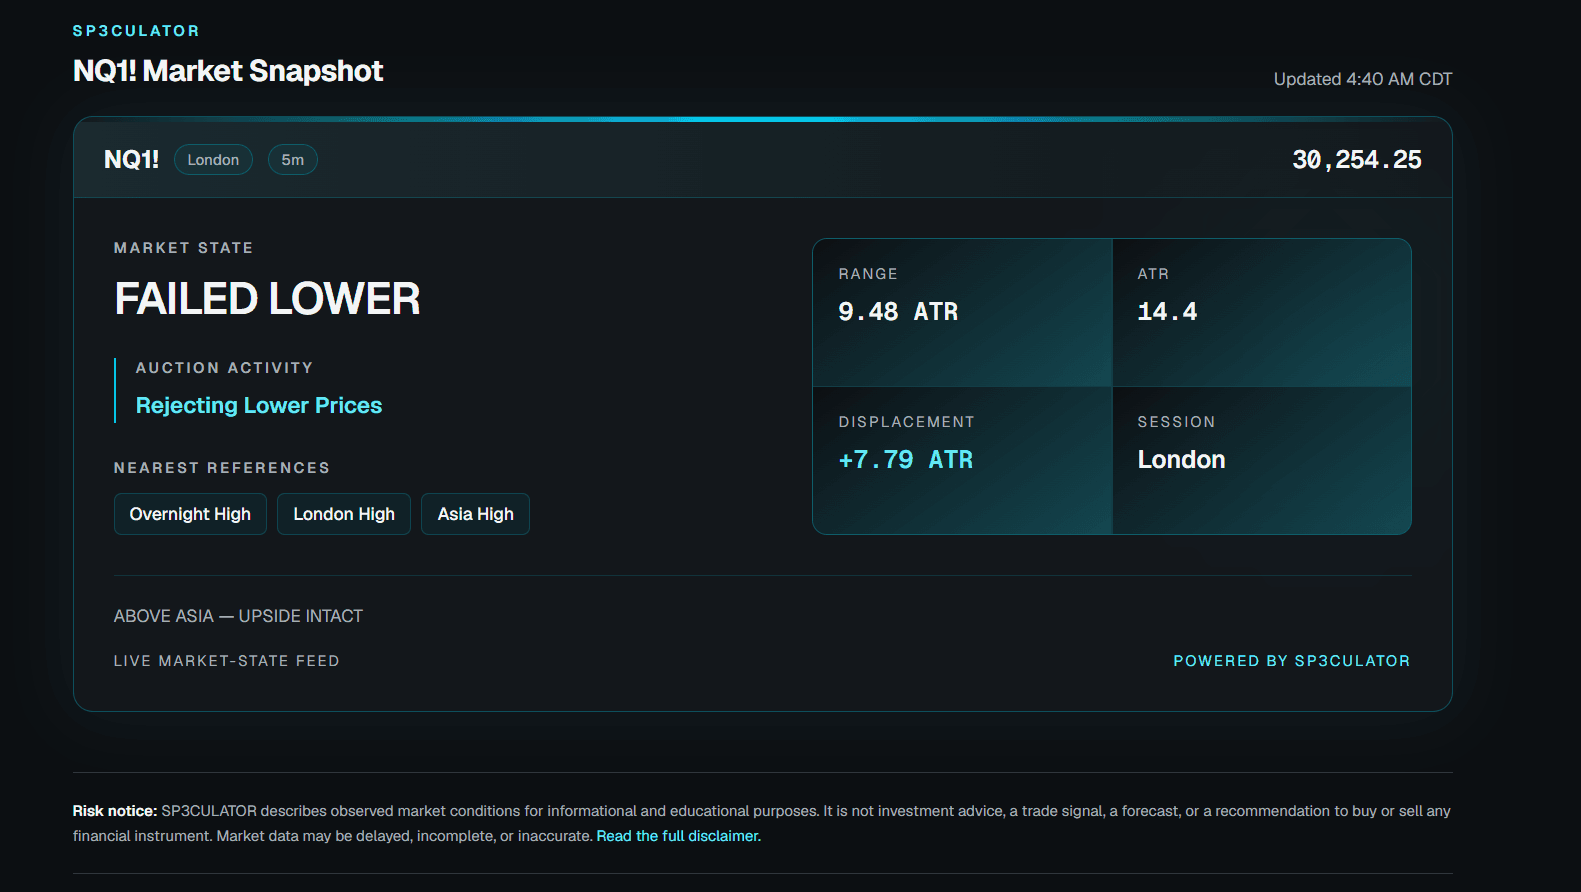
Live market state
The live feed describes the latest data received by Prop Informer. It may be delayed, incomplete or temporarily unavailable.
Reported Market State
Auction Activity
Rejecting Lower Prices
Price is inside the current value area and above RTH VWAP.
near · 1.50 pts · 0.05 ATR · Price above
extended · 13.98 pts · 0.49 ATR · Price below
extended · 14.50 pts · 0.51 ATR · Price below
extended · 22.50 pts · 0.79 ATR · Price below
VWAP +1 SD / Asia High
30,905.48–30,906.00
Midpoint 14.24 pts from price · 0.50 ATR to midpoint
ATR Upper / Value Area High
30,931.17–30,932.00
Midpoint 40.09 pts from price · 1.40 ATR to midpoint
RTH High / Previous 4H High
30,951.50–30,951.50
Midpoint 60.00 pts from price · 2.09 ATR to midpoint
FAILED LOWER
What it does
What it does not do
Continue exploring
Follow the live snapshots, explore Prop Informer’s educational guides and keep up with the rules and developments shaping the prop-firm and futures-trading industry.
Risk notice: SP3CULATOR describes observed market conditions for informational and educational purposes. It is not investment advice, a trade signal, a forecast, or a recommendation to buy or sell any financial instrument. Market data may be delayed, incomplete, or inaccurate. Read the full disclaimer.